Plotting Data
The TOM Toolkit provides a few basic plots, such as photometry, spectroscopy and target distribution. Sometimes it would be useful to visualize data in a different way.
In this tutorial you will learn how to build and display a very simple plot in our TOM: number of reduced data per target. The end result will demonstrate how to create a plot.ly plot with data from our TOM. You will even package the code in it’s own app so we can share it with other TOM users that might find it useful.
If you haven’t already read the documentation on customizing templates you should read it first. You’ll need to edit a template in order to view your new plot somewhere.
First, start a new app in our project to house the new plot (and perhaps other additions!):
./manage.py startapp myplots
This will create a new Django app in your project named myplots:
myplots
├── admin.py
├── apps.py
├── __init__.py
├── migrations
│   └── __init__.py
├── models.py
├── tests.py
└── views.py

1 directory, 7 files
Note you don’t necessarily have to start a new app. If you’ve already started an app that you’d like to reuse, that works too.
Now install the new app into your project’s settings.py file:
INSTALLED_APPS = [
    'django.contrib.admin',
    'django.contrib.auth',
    ...
    'myplots',
]
Now that the myplots app is installed, create the directories necessary to
contain your new plot:
mkdir -p myplots/templates/myplots
mkdir myplots/templatetags
The templates directory will contain the html template you can include in other templates to display your plot. The templatetags directory will contain the python code to construct the plot.ly plot.
Start by creating the templatetags file:
touch myplots/templatetags/myplots_tags.py
Edit this file, starting with the necessary imports:
from plotly import offline
import plotly.graph_objs as go
from django import template

from tom_targets.models import Target
The plotly imports are needed for building an offline plot. The django
template import gives access to the template library, which will allow for
registering the template tag. Finally, the TOM Toolkit Target class will allow
access to the Target model (for querying).
Next, add the boiler plate code for a template tag:
register = template.Library()


@register.inclusion_tag('myplots/targets_reduceddata.html')
def targets_reduceddata(targets=Target.objects.all()):
First we instantiate the register decorator. You don’t need to know much about
this other that it allows us to register functions as templatetags. The function
targets_reduceddata is decorated with the register decorator, which takes as
an argument the template to render. The function definition takes in a queryset of
Targets as a keyword argument, but if none are supplied, defaults to all Targets
in the database.
Next, add the function body:
    # order targets by creation date
    targets = targets.order_by('-created')
    # x axis: target names. y axis: datum count
    data = [go.Bar(
        x=[target.name for target in targets],
        y=[target.reduceddatum_set.count() for target in targets]
    )]
    # Create the plot
    figure = offline.plot(go.Figure(data=data), output_type='div', show_link=False)
    # Add plot to the template context
    return {'figure': figure}
As the comments describe, the function code iterates over each Target in the
targets queryset adding the target name and datum count as x/y values to the
Bar data structure. Check out the plot.ly bar chart
documentation for more information about the
options available to you. As an exercise, try changing the values in the y axis.
Or you could use a different chart type.
Finally, the code adds the plot.ly plot to the template rendering context. Next we will create this template where this context will be rendered.
Create the file, making sure it matches the template name specified in the template tag definition beforehand:
touch myplots/templates/myplots/targets_reduceddata.html
This file contains the simple contents:
{% raw %}
{{ figure|safe }}
{% endraw %}
All this template does is output the figure variable, which is the html
generated from plotly in the templatetag. We also tell django that the output is
safe, so that it doesn’t escape the html. That’s it.
Note: If you’re running the development server, restart it now. Django doesn’t automatically pick up new templatetags.
Now that the templatetag and template are complete, we can use it in any template. You might have your own templates which you’d like to add the plot to, or perhaps you’ve customized one of the TOM supplied templates as per the customizing templates documentation. Either way, including the templatetag works the same way. At the top of the template (after any ‘extends’) load the new tag library:
{% raw %}
{% load myplots_tags %}
{% endraw %}
Now insert the templatetag somewhere in the template where you’d like it to appear:
{% raw %}
{% targets_reduceddata %}
{% endraw %}
If your parent template already has a queryset of targets available in the context (for example, a target list page) you can pass it in to be used in your plot:
{% raw %}
{% targets_reduceddata targets %}
{% endraw %}
Otherwise the plot will simply use all targets in your database. Either way, you should end up with something like this:
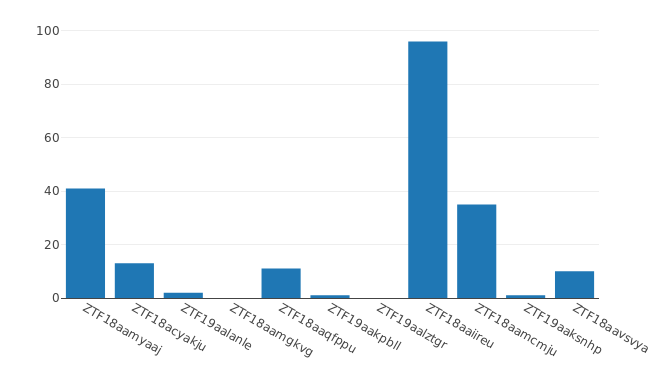
That’s it! Plot.ly provides a wide range of plotting capabilities, you should reference the documentation for more information. It would also be helpful to read Django’s ORM to become familiarized with wide range of methods of querying data.